RPA Productivity Report

PowerBI to generate weekly reports that displays benefits of RPA usage.
Summary
- Role: Business Automation Dev
- Duration: 1 Week
- Start: September 2025
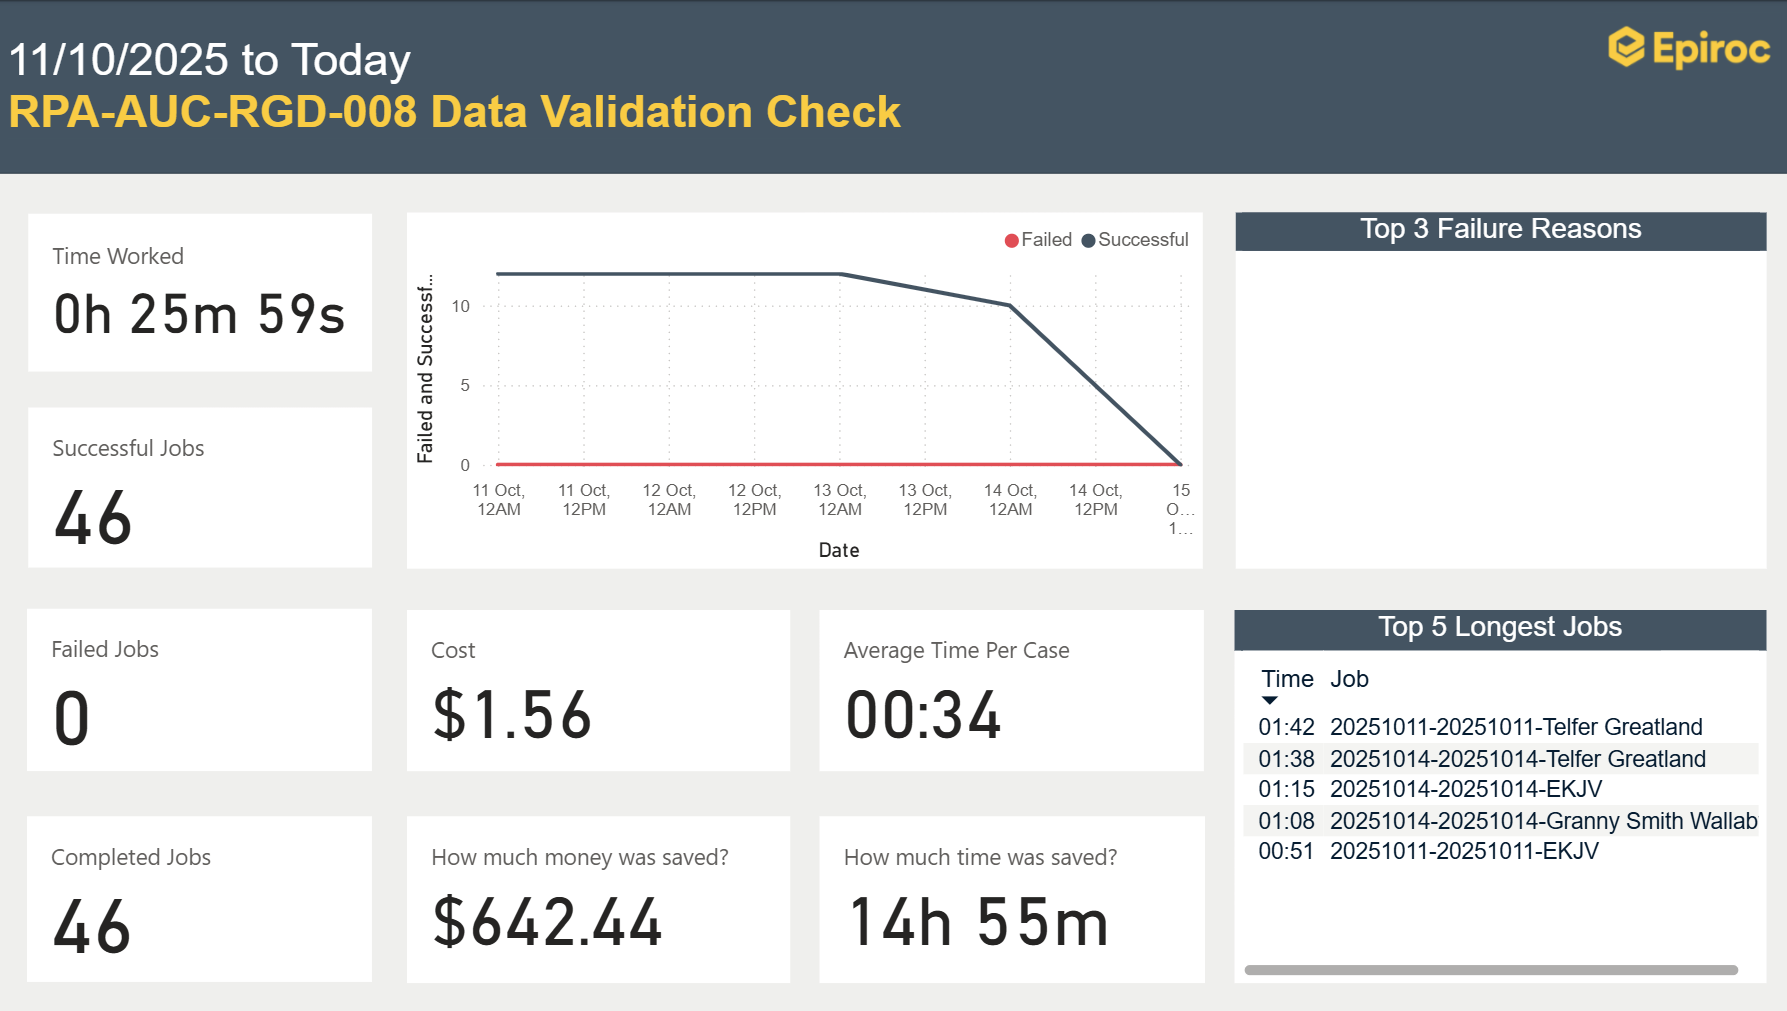
This was my first larger project using Power BI, for which I completed an introductory course beforehand. The goal was to create a dashboard that clearly showcases the benefits of Robotic Process Automation (RPA) to stakeholders by visualizing usage data and calculated savings. The RPA data was retrieved from the Application database and processed in Power BI. The dashboard includes metrics such as average job duration, total execution time, successful and failed jobs, as well as the top five longest-running jobs. In addition, further process metadata such as Name, Identifier and Unit Costs were stored in Sharepoint which needed to be imported to calculate the final savings. One of the main challenges was data modeling. The source data from the application database was not structured in a way that could directly be used in Power BI with filters, slicers, and relational visuals. Therefore, I had to design my own data model and do data transformations in the Power Query Editor. This included restructuring tables, creating relationships and new fields for specific calculations. This project helped me build a solid foundation in Power BI and data visualization.